300x250
<이론>


<실습>
1. K-Nearest Neighbor Classifier Example
- 필요한 라이브러리 입력
|
import numpy as np
from matplotlib import pyplot as plt
from sklearn.neighbors import KNeighborsClassifier
|
cs |
- sklearn.neighbors의 KNeighborsClassifier import!
- features 입력
-
import pandas as pdimport numpy as npfrom sklearn.neighbors import KNeighborsClassifierfrom sklearn.model_selection import train_test_splitfrom sklearn.metrics import confusion_matrixfrom sklearn.metrics import accuracy_scorefrom sklearn import preprocessing
cs
|
# first class (blue)
x_blue = np.array([0.3, 0.5, 1, 1.4, 1.7, 2])
y_blue = np.array([1, 4.5, 2.3, 1.9, 8.9, 4.1])
# second class (red)
x_red = np.array([3.3, 3.5, 4, 4.4, 5.7, 6])
y_red = np.array([7, 1.5, 6.3, 1.9, 2.9, 7.1])
# features
X = np.array([[0.3, 1], [0.5, 4.5], [1, 2.3], [1.4, 1.9], [1.7, 8.9], [2, 4.1], [3.3, 7], [3.5, 1.5], [4, 6.3], [4.4, 1.9], [5.7, 2.9], [6, 7.1]])
y = np.array([0, 0, 0, 0, 0, 0, 1, 1, 1, 1, 1, 1]) # 0 : blue, 1 : red
|
cs |
- x_blue : 파란 점의 x좌표
- y_blue : 파란 점의 y좌표
- x_red : 빨간 점의 x좌표
- y_red : 빨간 점의 y좌표
- X : [x좌표, y좌표]
- y : 파란색이면 0, 빨간색이면 1
- plot
|
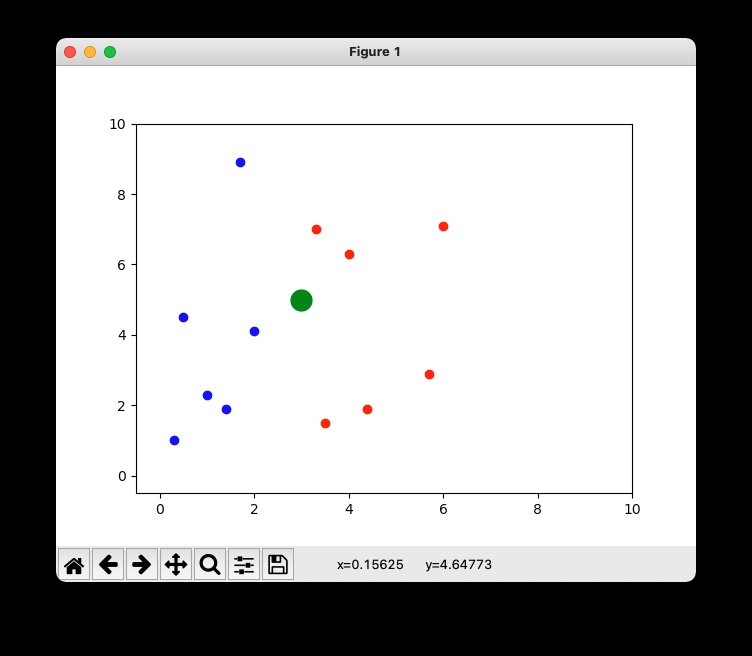
# plot
plt.plot(x_blue, y_blue, 'ro', color='blue')
plt.plot(x_red, y_red, 'ro', color='red')
plt.plot(3, 5, 'ro', color='green', markersize=15)
plt.axis([-0.5, 10, -0.5, 10])
plt.show()
|
cs |
- 결과
- K-Nearest Neighbor Classifier
-
#KNclassifierclassifier = KNeighborsClassifier(n_neighbors=3) # concerns 3 neighborsclassifier.fit(X, y)predict = classifier.predict(np.array([[5, 5]]))print(predict)plt.show()
cs
- predict : [5, 5] 점 분류 (빨강 or 파랑) - 결과 - - classifier : 3 개의 이웃한 점 고려

2. Credit_data.csv 분류
- 필요한 라이브러리 입력
|
import pandas as pd
import numpy as np
from sklearn.neighbors import KNeighborsClassifier
from sklearn.model_selection import train_test_split
from sklearn.metrics import confusion_matrix
from sklearn.metrics import accuracy_score
from sklearn import preprocessing
|
cs |
- train_test_split : train data와 test data를 구분해줌
- preprocessing :
- data 불러오기
|
# Features
data = pd.read_csv("credit_data.csv")
features = data[["income", "age", "loan"]]
target = data.default
# Machine learning handle arrays not data-frames
X = np.array(features).reshape(-1, 3) # 3개의 열로 나타내줌
y = np.array(target)
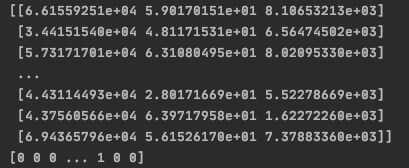
print(X)
print(y)
|
cs |
- credit_data.csv 파일

- print(X), print(y)의 결과
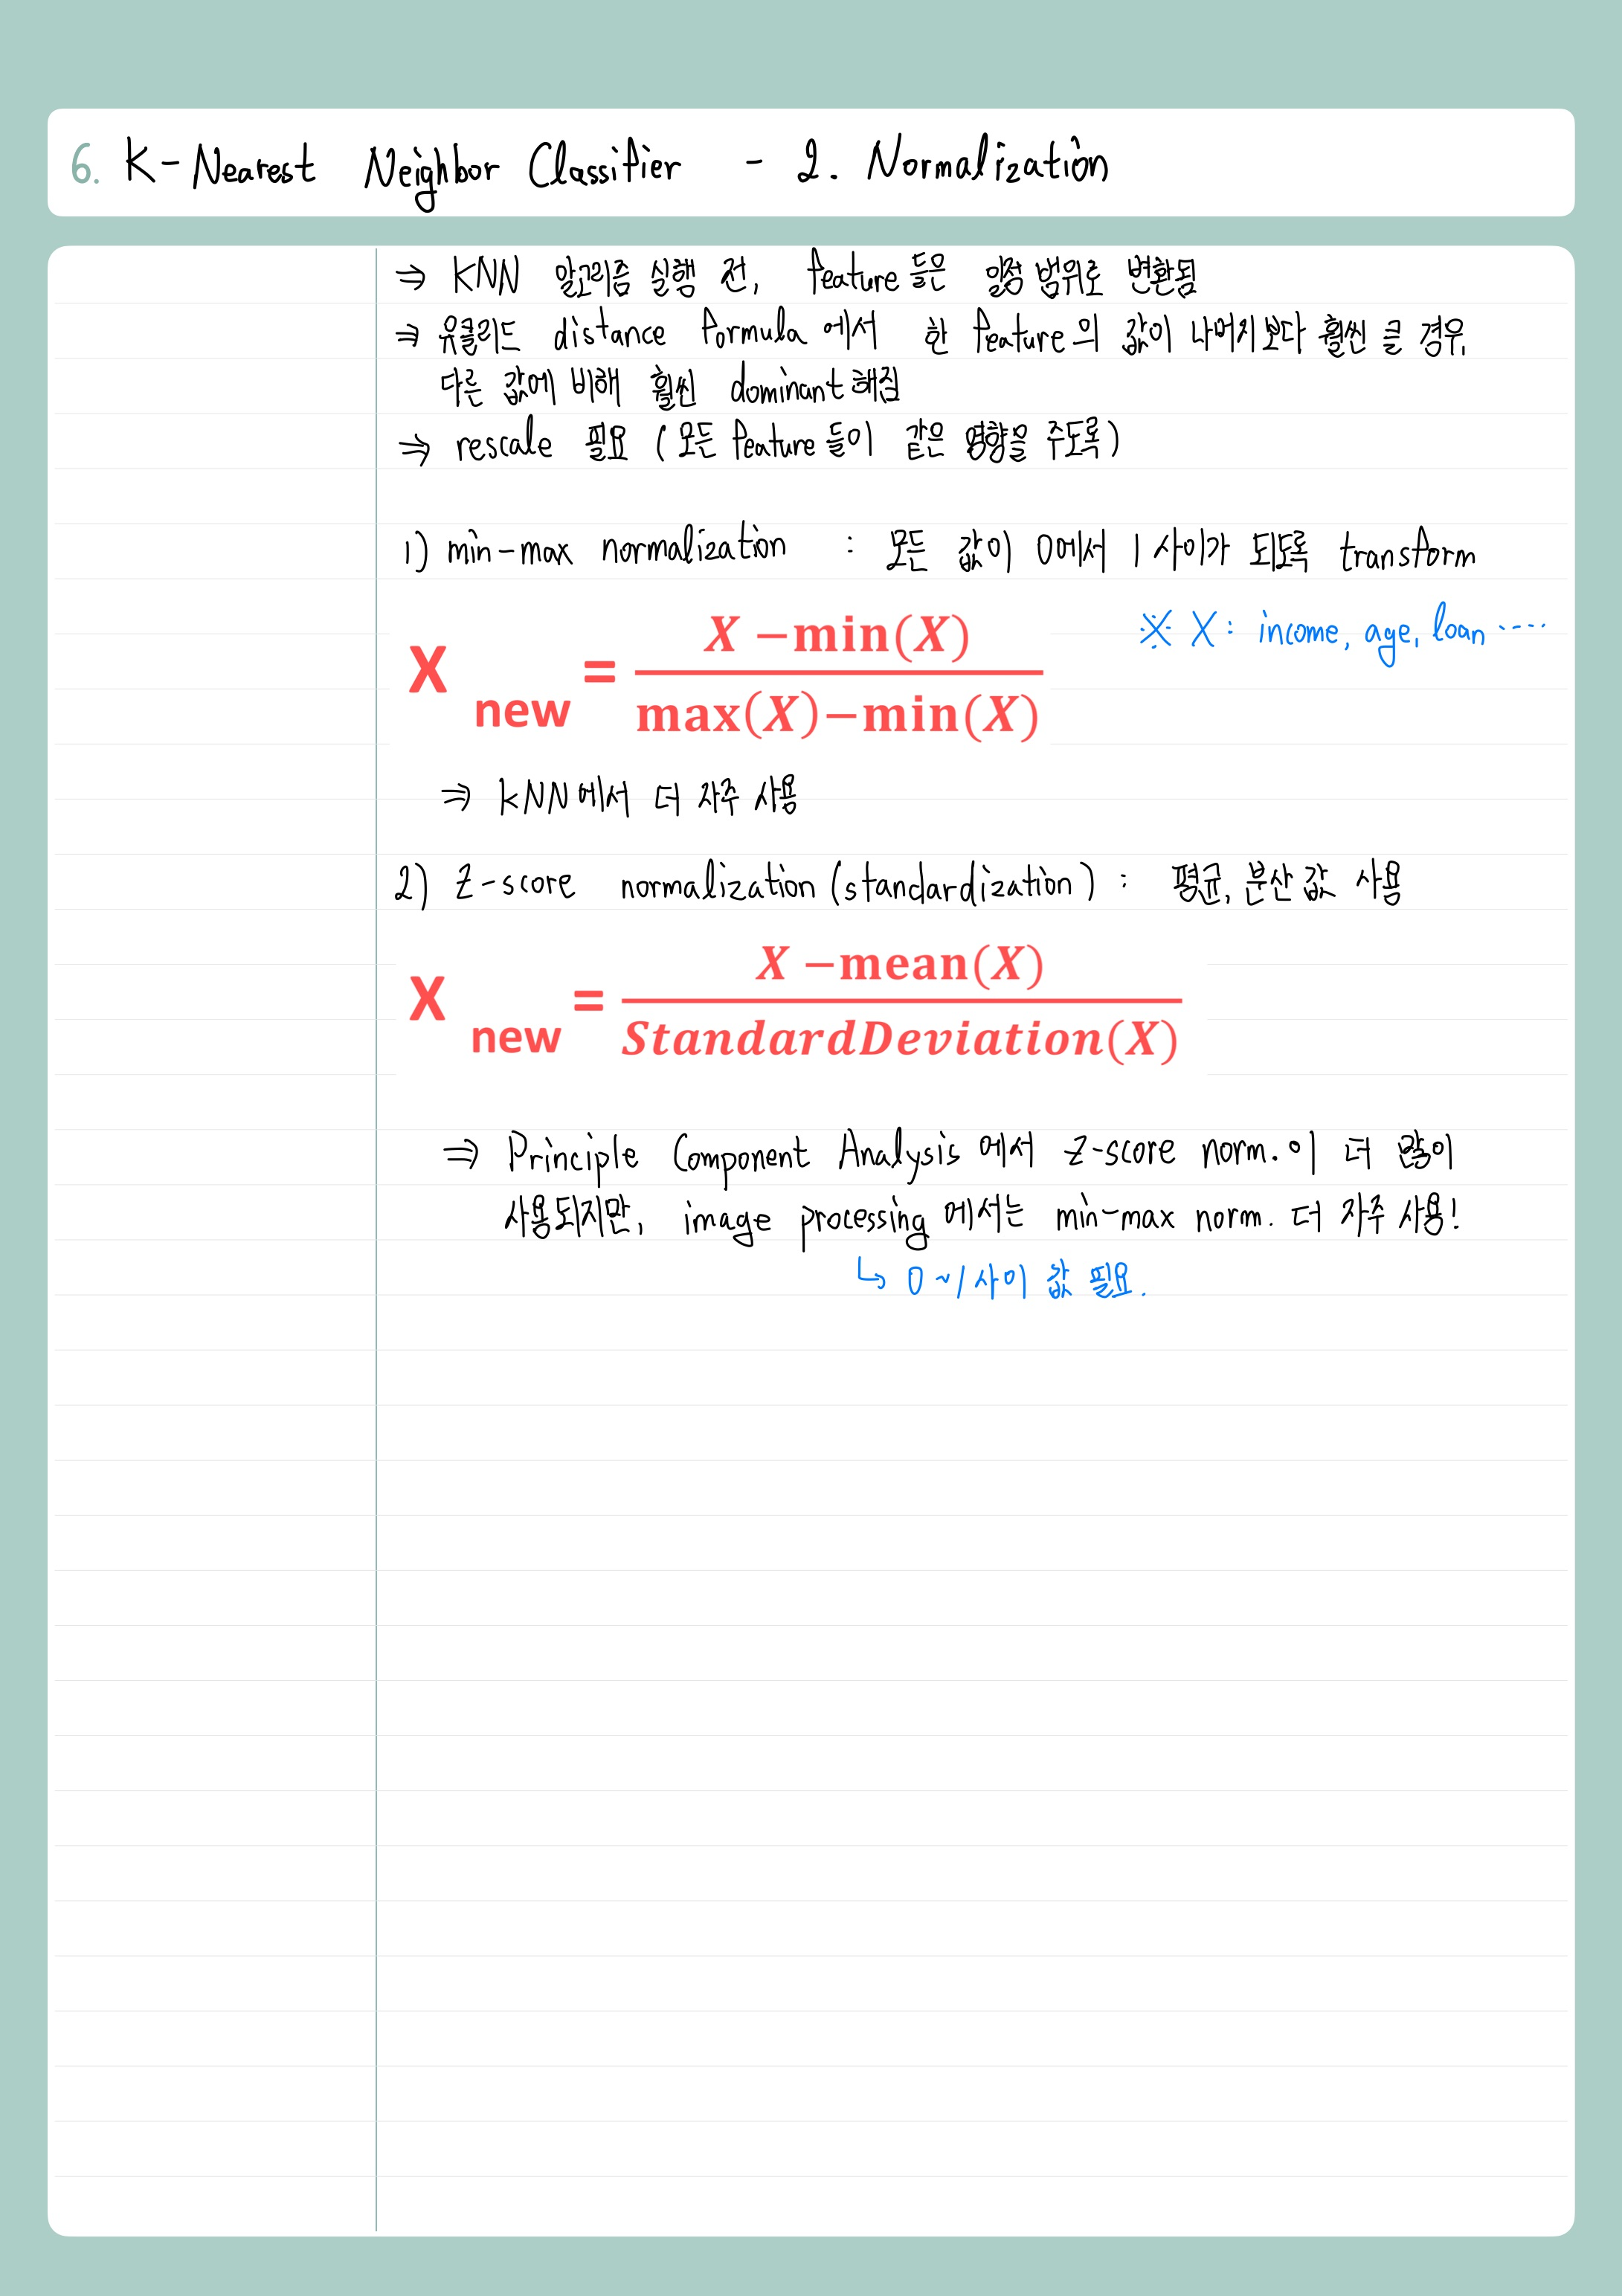
- Normalization (Preprocessing)
- Preprocessing and Data Splitting
|
# Preprocessing
X = preprocessing.MinMaxScaler().fit_transform(X)
# train, test spliting
feature_train, feature_test, target_train, target_test = train_test_split(X, y, test_size=0.3)
# Classifier
model = KNeighborsClassifier(n_neighbors=20)
fitted_model = model.fit(feature_train, target_train) # train
predictions = fitted_model.predict(feature_test) # test
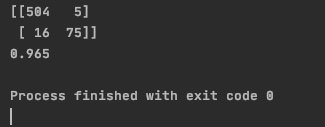
print(confusion_matrix(target_test, predictions))
print(accuracy_score(target_test, predictions))
|
cs |
- 결과
- 정확도를 더 올리기 위해 Cross Validation 적용
|
from sklearn.model_selection import cross_val_score
|
cs |
|
# Classifier
model = KNeighborsClassifier(n_neighbors=32)
fitted_model = model.fit(feature_train, target_train) # train
predictions = fitted_model.predict(feature_test) # test
cross_valid_scores = []
for k in range(1, 100):
knn = KNeighborsClassifier(n_neighbors=k)
scores = cross_val_score(knn, X, y, cv=10, scoring='accuracy') # ten values
cross_valid_scores.append(scores.mean())
print("Optimal k with cross-validation: ", np.argmax(cross_valid_scores))
print(confusion_matrix(target_test, predictions))
print(accuracy_score(target_test, predictions))
|
cs |
- 결과

- 정확도 : 98.16%
- Logistic Regression Model은 K-Nearest Neighbor Model보다 복잡하고, 정확성이 떨어짐을 알 수 있음.
728x90


최근댓글