논문에서 classification 관련 evaluation을 진행할 때, top-k recall(recall at k, R@k) 등의 형태로 recall이라는 metric을 많이 사용한다. 항상 헷갈리는 precision, recall 및 이와 관련된 개념을 정리해보고자 한다.
목차
Evaluation Metrics for Classification
Classification task를 평가할 때에는 보통 두 가지 경우로 나누어 평가한다.
Multi-class classification
먼저, multi-class classification의 경우에는 다음 식으로 간단히 accuracy를 계산할 수 있다. 하지만 data가 imbalance할 경우, accuracy가 높다고 무조건 좋은 것은 아니므로 주의해야 한다.
\( \cfrac{1 \left[ \text{argmax}(\hat{\mathbf{y}}^{(i)} = \mathbf{y}^{(i)} \right]}{N} \)
Binary Classification
다음으로, class가 두 개인 binary classification의 경우에는 다음과 같은 metric이 있다.
- Classification threshold에 영향을 받는 metrics (prediction 값 결과의 범위가 \([0, 1]\)인 경우, 0.5를 threshold로 사용한다.)
- Accuracy
- Precision/Recall
- Classification threshold에 영향을 받지 않는 metrics
- ROC AUC
Binary Classification에 사용되는 metric들을 각각 자세히 살펴보자.
(1) Accuracy, Precision(P), Recall(R), F1 Score
Binary classification 결과 다음과 같은 confusion matrix를 얻었다고 해보자.
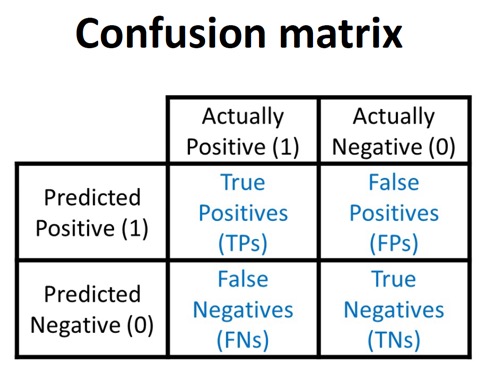
여기서 accuracy, precision, recall, f1 score는 각각 다음과 같이 구한다.
- Accuracy : 일반적인 정확도이다. 전체 데이터 중 맞게 분류한 data의 비율이다.
- \( \cfrac{\text{TP} + \text{TN}}{\text{TP} + \text{TN} + \text{FP} + \text{FN}} = \cfrac{\text{TP} + \text{TN}}{\lvert \text{Dataset} \rvert} \)
- Precision (P) : 모델이 positive로 예측한 것 중 진짜 positive인 data의 비율을 말한다.
- \( \cfrac{\text{TP}}{\text{TP} + \text{FP}} \)
- Recall (R) : 실제로 positive인 것 중 모델이 positive로 예측한 data의 비율을 말한다.
- \( \cfrac{\text{TP}}{\text{TP} + \text{FN}} \)
- F1 score : Precision과 Recall의 조화 평균(작은 값의 영향이 더 큼)로 계산한 정확도 개념이다. (F-score @ 1)
- \( \cfrac{2 P R}{P + R} \)
(2) ROC(Reciever Operating Characteristic) Curve, ROC AUC(Area Under the ROC Curve)
ROC curve는 binary classifier의 classification threshold의 변화에 따른 TPR(Recall)과 FPR의 trade-off 관계를 파악하기 위한 curve이다.
클래스 별로 분포가 다를 때(imbalance data일 때), accuracy의 단점을 해결한 분류 성능 지표이다.
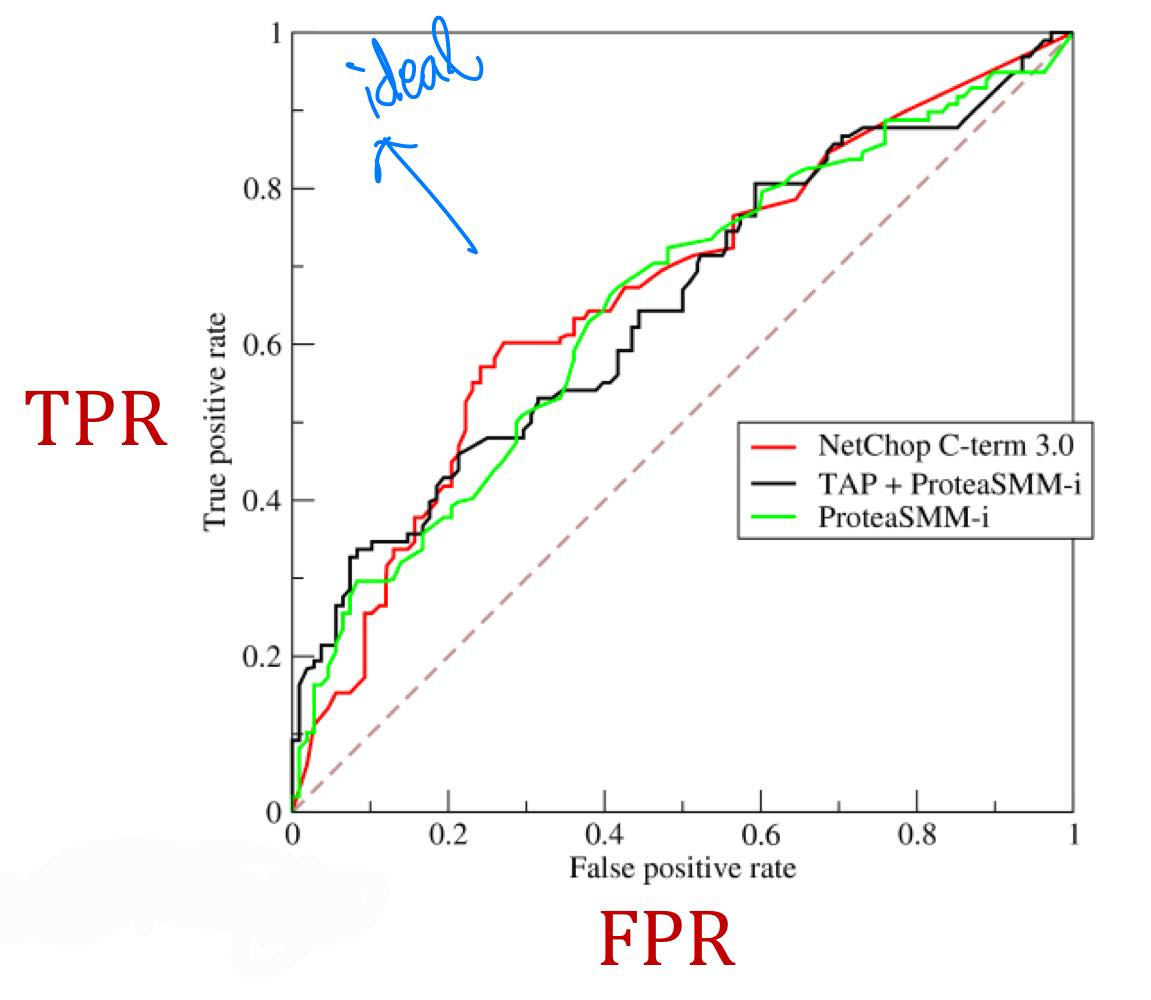
- TPR (True Positive Rate, Recall) : 실제 positive data 중 positive로 예측한 data의 비율
- \( \cfrac{\text{TP}}{\text{TP} + \text{FN}} \)
- FPR (False Positive Rate) : 실제 negative data 중 positive로 예측한 data의 비율
- \( \cfrac{\text{FP}}{\text{FP} + \text{TN}} \)
점선은 random classifier의 성능을 나타낸다. 즉 점선에서 멀수록 좋은 binary classifier이다.
ROC AUC는 ROC curve 아래의 면적을 나타낸다. 이는 random으로 positive 데이터와 negative 데이터를 하나씩 골랐을 때, classifier가 제대로 분류할 확률이다. 이상적인 경우 AUC = 1('ㄱ'자 형태의 그래프), 최악의 경우 AUC = 0.5(점선)이다. 완전히 랜덤으로 positive/negative를 분류할 때(최악일 때) 0.5, negative는 negative로, positive는 positive로 분류할 때 1의 값을 보일 것이다.
Top-k recall(Recall@k) & Top-k precision(Precision@k)
Recall at k(Recall@k), Precision at k(Precision@k) 개념은 추천시스템에서 많이 사용하는 evaluation metric이다.
위에서 언급했듯, binary classification metric으로써의 recall과 precision의 정의는 다음과 같았다.
- Recall : 실제 positive 중 positive로 예측한 비율
- Precision : 실제 positive 중 진짜 positive의 비율
Recall at k, Precision at k in Recommender Systems
'at k'라는 개념이 추가되었을 때, 추천시스템에서의 'recall at k'와 'precision at k'의 정의는 다음과 같다.
\( \text{Recall@k} = \cfrac{\text{relevant recommended items}}{\text{all the possible relevant items}} \)
\( \text{Precision@k} = \cfrac{\text{relevant recommended items}}{\text{total recommended items}} \)
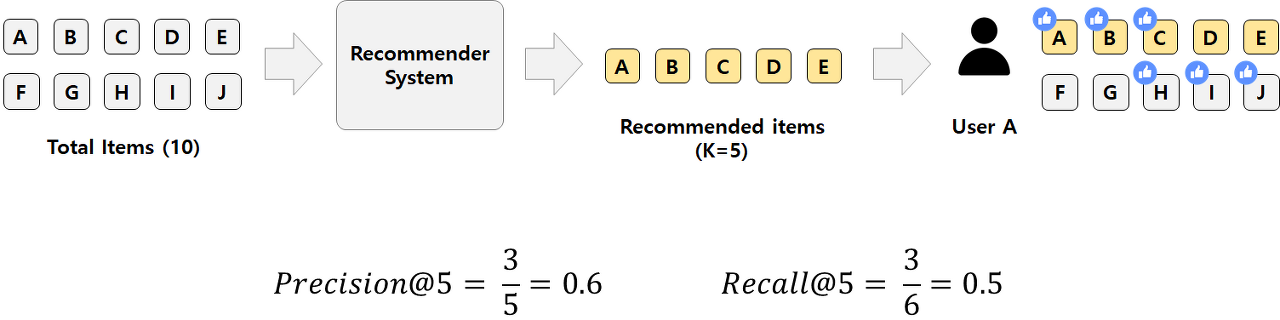
위 예시와 함께 알아보자.
Top-k recall은 모델이 k개 추천했을 때(k=5), 사용자가 관심있는(possible relevant) 모든 품목(A,B,C,H,I,J) 중 모델이 추천하기도 한(relevant recommended) 품목(A,B,C)의 비율이고, top-k precision은 모델이 추천한(recommended) 품목 k개(5) 중 사용자가 관심도 있는(relevant recommended) 품목(A,B,C)의 비율이다.
이때 Recall at k (Recall@5)는 다음과 같이 구할 수 있다.
\( \text{Recall@5} = \cfrac{\text{relevant & recommended}}{\text{all possible relevant}} = \cfrac{3}{6} = 0.5 \)
Precision at k(Precision@5)는 다음과 같이 구한다.
\( \text{Precision@5} = \cfrac{\text{relevant & recommended}}{\text{total recommended}} = \cfrac{3}{5} = 0.6 \)
Recall at k in Scene Graph (example)
Recall@k를 활용한 Scene graph prediction network(SGPN)의 evaluation 과정을 해석해보자. (논문 분석 링크)
Scene graph는 \(\{Subject, Predicate, Object\}\) triplet으로 이루어지는데, ground-truth scene graph와 예측한 scene graph를 비교하기 위해 top-k recall을 사용한다. 그 결과의 예시는 다음과 같다.
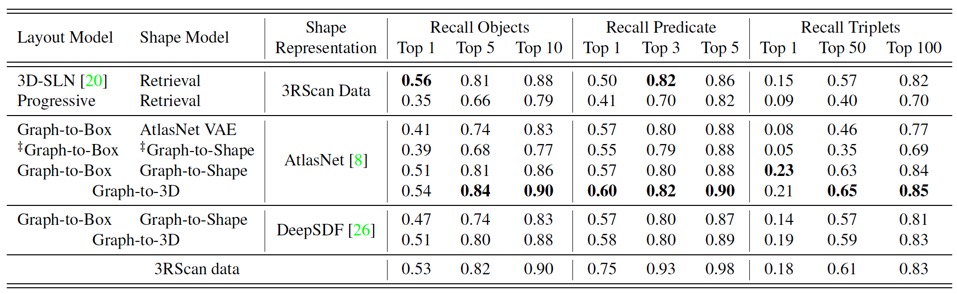
위 표의 'Recall Objects'열을 예로 들어보면, Top 1, Top 5, Top 10에 대한 여러 모델의 값들이 나열되어 있다. Top 10인 경우 Top-k recall의 개념을 적용하여 해석해보면, Top-k recall object란 모델이 k개(k=10)를 예측했을 때, GT scene graph의 (실제) object 중 예측을 잘 한(맞춘) object의 비율로 해석해볼 수 있다.
이는 predicate, triplet에도 마찬가지로 적용할 수 있으며, triplet은 (subject, predicate, object)가 모두 맞는 경우를 따지므로 전체적으로 값이 작아짐을 볼 수 있다.


최근댓글