Trimesh는 mesh와 point cloud를 다루는 파이썬 패키지로, 이 데이터들의 전처리에 아주 많이 사용된다. 그런데 3D 데이터를 시각화하는 데에도 사용될 수 있어(특히 웹 환경에서 사용이 가능해서), 예시와 함께 자세히 다뤄보려 한다. (사용해보면서 내용을 추가할 예정이다.)
공식 문서는 다음을 참조하자. 작성일 당시 사용한 버전은 3.15.9버전이다.
Basic Installation — trimesh 3.15.9 documentation
Import meshes from binary/ASCII STL, Wavefront OBJ, ASCII OFF, binary/ASCII PLY, GLTF/GLB 2.0, 3MF, XAML, 3DXML, etc.
trimsh.org
목차
Installation
기본적으로 numpy만 깔려있다면 trimesh를 사용할 수 있다. trimesh 설치는 다음과 같은 명령어로 가능하다.
pip install trimesh
Functions and Classes
본래 패키지의 목적이 시각화가 아닌 데이터 전처리여서, 시각화보다는 데이터 처리와 관련하여 매우 다양한 기능을 제공한다. 이는 연구를 진행하면서 새로운 내용이 나올 때마다 추가할 예정이다.
'trimesh.load()' Function
trimesh.load(file_obj, file_type=None, resolver=None, force=None, **kwargs) 는 mesh 혹은 path를 통해 데이터를 불러오는 함수이다.
Parameters
- file_obj(str, or file- like object) : 불러올 데이터 source
- file_type(str) : stl, ply 등 불러올 파일의 type
- resolver(trimesh.visual.Resolver) : Material, texture 등 mesh의 특성을 담은 object
- force(None or str)
- 'mesh' : 강제로 scene을 single mesh로 만든다.
- 'scene' : 강제로 모든 것을 scene으로 만든다.
Returns
trimesh 클래스로 불러온 geometry를 반환한다. (return type : Trimesh, Path2D, Path3D, Scene)
이외에도 trimesh.load_mesh() 혹은 trimesh.load_path() 함수로 mesh나 path를 특정하여 불러올 수도 있다.
혹은 trimesh.load_remote() 함수로 URL로부터 mesh를 불러올 수도 있다.
'trimesh.Scene()' Class
trimesh.Scene(geometry=None, base_frame='world', metadata={}, graph=None, camera=None, lights=None, camera_transform=None) 은 pyglet이나 openGL로 바로 렌더링할 수 있는 scene graph이다.
간단히 trimesh.Scene(mesh)와 같은 형식으로 instance를 생성해줄 수 있다.
__init__
- geometry(Trimesh, Path2D, Path3D PointCloud or list) : scene에 추가할 geometry
- base_frame(str or hashable) : base frame의 이름
- metadata(dict) : scene에 대한 metadata
- graph (TransformForest or None), camera (Camera or None), lights ([trimesh.scene.lighting.Light] or None) : Scene과 관련된 transform graph, camera, light 정보
- camera_transform ((4,4) float or None) : base frame에서의 camera의 homogeneous transformation matrix
- apply_transform() 함수로 카메라의 transform 구현 가능
show(viewer=None, **kwargs)
show()함수는 scene을 화면에 표시하기 위한 함수이다.
- viewer (str) : 뷰어를 직접 선택해줄 수 있다. 'gl'을 주면 pyglet window를 열고, 'notebook'을 주면 jupyter notebook 상에서 동작한다. 일반적으로 자동으로 정해진다.
- kwargs (dict) : automatic smooth shading을 적용해줄 수 있다.
add_geometry(geometry, node_name=None, geom_name=None, parent_node_name=None, transform=None, extras=None)
scene에 geometry를 추가하는 함수이다.
- geometry (Trimesh, Path2D, Path3D PointCloud or list) : scene에 추가될 geometry
node_name (str)을 반환한다.
'trimesh.Trimesh()' Class
trimesh.Trimesh(vertices=None, faces=None, face_normals=None, vertex_normals=None, face_colors=None, vertex_colors=None, face_attributes=None, vertex_attributes=None, metadata=None, process=True, validate=False, merge_tex=None, merge_norm=None, use_embree=True, initial_cache=None, visual=None, **kwargs) 클래스는 triangular 3D mesh 정보를 담는 핵심 클래스이다.
자주 사용하는 argument 위주로 알아보자.
__init__
- vertices ((n, 3) float) : vertex 위치를 나타내는 array
- faces ((m, 3) or (m, 4) int) : triangular 혹은 quad face를 나타내는 array
- face_normals ((m, 3) float) : face의 normal vector를 나타내는 array
- vertex_normals ((n, 3) float) : vertex의 normal vector를 나타내는 array
'trimesh.primitives.Sphere()' Class
trimesh.primitives.XXX()를 통해 여러 3D primitive를 생성할 수 있다. XXX에는 Box, Cylilnder, Capsule, Extrusion, Sphere 등의 primitive가 입력되고, 각 primitive에 따라 조금씩 생성 방법이 다르다. 모두 Trimesh class의 subclass이다.
대표적으로 Sphere를 살펴보고, 더 자세한 내용은 document를 참조하자.
__init__(*args, **kwargs)
Sphere의 경우 다음과 같은 인자를 받는다.
- radius (float) : Radius of sphere
- center ((3,) float) : Center position of sphere
- subdivisions (int) : Number of subdivisions for icosphere
추가로 area, to_dict, volume, center 등의 property를 갖는다.
'trimesh.points.PointCloud()' Class
trimesh.points.PointCloud(vertices, colors=None, metadata=None, **kewargs) 는 scene에 시각화 할 수 있는 3D point 정보를 담는 object이다. (실제 사용할 때에는 points를 제외하고 'trimesh.PointCloud()'로 많이 선언한다.)
__init__
- vertices ((n, 3) float) : 공간 상의 points
- colors ((n, 4) uint8 or None) : RGBA (4차원 vector) color로, 기본적으로 각 point마다 지정하지만, color 하나를 지정하면 모든 points가 같은 color가 된다.
- metadata (dict or None) : Metadata about points
Visualization in Web Environment
우선은 웹, 즉 jupyter notebook이나 jupyter lab 환경에서 사용하는 방법을 다뤄보고자 한다.
데이터를 시각화하기 위한 (가장 간단한) 과정은 다음과 같이 요약할 수 있다.
- 데이터 load : trimesh.load() 함수
- Scene 생성 : trimesh.Scene() 클래스
- 창 띄우기 : scene.show() 함수
예시로 알아보자.
Simple Visualization
예시는 Jupyter Lab 환경에서 진행했다.
먼저, 필요한 라이브러리들을 import한다.
import numpy as np
import trimesh
다음 코드로 웹 환경(IPython 혹은 Jupyter notebook)에서 작동중인지 확인해볼 수 있다.
trimesh.viewer.notebook.in_notebook()웹 환경에서 작동중이라면 True를, 아니면 False를 출력한다.
그리고, trimesh.load()함수로 데이터를 불러온다.
path = "/data/path"
mesh = trimesh.load(path)
간단한 시각화를 위해 다음과 같이 scene instance를 생성해준다.
scene = trimesh.Scene(mesh)
마지막으로 show() 함수로 cell 아래에 scene을 띄워준다.
scene.show()
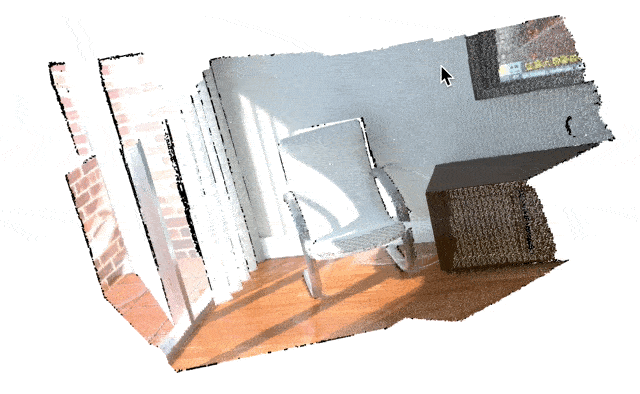
Visualization 결과는 아래와 같다. 마우스 드래그로 카메라 방향을 전환해줄 수 있고, 휠로 확대/축소도 가능하다.
Visualization with Added Points
어떤 3D scene에 원하는 점을 추가하여 시각화해보자.
먼저 위와 같이 trimesh.load() → trimesh.Scene()을 통해 instance까지 만들어준다.
다음으로, 추가하고 싶은 점을 np.array로 나타내준다. 여기서는 random point를 생성하여 띄워보겠다. 색은 빨간색으로 설정한다.
rand_points = np.random.randn(10, 3) # 10 points with 3 pixel coordinates
red = [255, 0, 0, 0] # RGBA color
trimesh.points.PointCloud() 객체를 생성한다, 이때 color 인자에는 원래 point 개수만큼의 dimension을 추가로 주어야 하지만, 간단히 하나의 색만 넘겨주면 알아서 한 가지 색으로 통일된다. 혹은 PointCloud의 color 인자에 trimesh.visual.random_color()를 주어 랜덤 색상을 부여해줄 수도 있다.
pc = trimesh.points.PointCloud(rand_points)
pc.colors = red
마지막으로, scene에 add_geometry() 함수를 통해 점을 추가하여 show()함수를 실행해준다.
scene.add_geometry(pc)
scene.show()
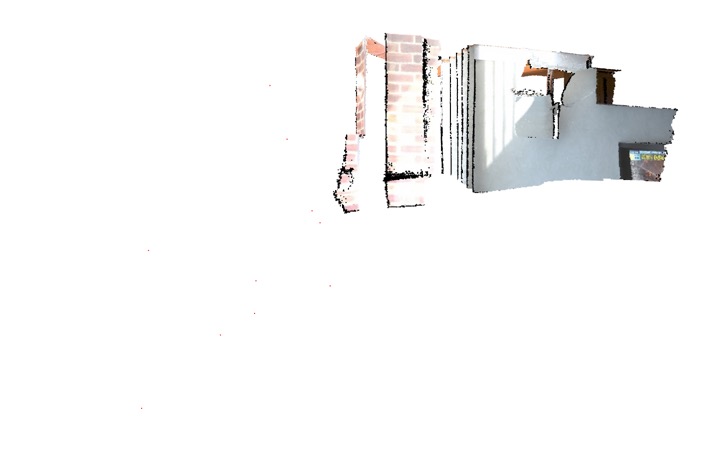
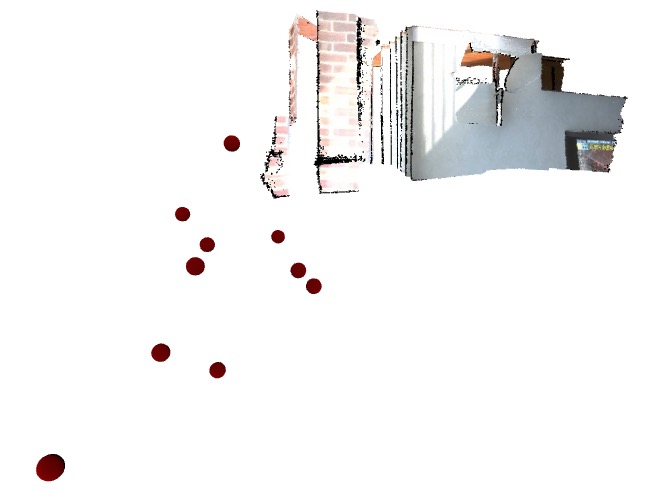
하지만 점만 나타내면 크기가 너무 작아서 잘 보이지 않는다. 좀 더 큰 점을 찍기 위해서는 show()함수의 인자로 show(line_settings={'point_size':100})과 같이 적용하면 되는데, 문제는 viewer가 'gl', 즉 pyglet을 사용하여 창을 띄워서 볼 때만 적용이 된다.
따라서 viewer가 'notebook'인 경우에는 다음과 같이 적당한 크기의 sphere를 할당하여 구현해주었다.
scene = trimesh.Scene(mesh)
points = []
for i in range(len(rand_points)):
	point = trimesh.primitives.Sphere(radius=0.1, center=rand_points[i])
    point.visual.vertex_colors = [255, 0, 0, 0]
    points.append(point)

scene.add_geometry(points)
scene.show()
결과는 아래와 같다.


최근댓글